Introduction
Physiography
Weather Data
Geologic History
Changing Climates
Weathering & Erosion
Carbonate Rocks
Granitic Rocks
Volcanic Rocks
Faults
Pediments
Stream Channels
Stream Terraces
The Mojave River
Playas
Sand Dunes
Human Impacts
References
-.-
Landforms & Erosional Processes
Weather Data
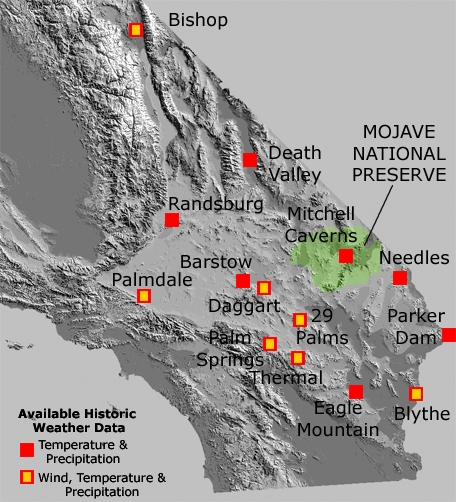
Historic weather data for the Mojave National Preserve is relatively limited because the region lacks large population centers and major airports where long-term meteorological records are typically maintained. As a result, much of the available climate information for the preserve relies on weather stations located in surrounding communities across the greater Mojave Desert region. Although none of these stations are located within the preserve itself, their records provide useful proxy data that help illustrate general weather patterns affecting the area.These regional observations confirm what long-time desert residents already understand about the Mojave climate. Summers are extremely hot, with daytime temperatures frequently exceeding 100°F across the lower desert basins. Winters are comparatively cool and occasionally cold, particularly at higher elevations where nighttime temperatures may drop below freezing.
Most of the region’s precipitation falls during the winter months as Pacific storm systems move across the southwestern United States. However, the desert also receives occasional late-summer rainfall associated with the North American monsoon. During August, brief but intense thunderstorms may develop, producing localized downpours, lightning, and sudden flash floods.
Seasonal wind patterns are also characteristic of the Mojave Desert. Spring is generally the windiest period of the year, when strong pressure gradients generate frequent gusty conditions and blowing dust. In contrast, autumn tends to be the driest and least windy season, often bringing clear skies and stable weather before the onset of winter storms.
Together, these patterns—extreme summer heat, cool winters, winter-dominant precipitation with occasional summer monsoonal storms, and seasonal wind cycles—define the climate regime that shapes the landscapes and ecosystems of the Mojave National Preserve and surrounding desert regions.
| Location | Barstow | Bishop | Blythe FAA |
Daggett FAA | Death Valley | Eagle Mountain | Mitchell Caverns** |
| Latitude | N34-54 | N37-22 | N33-37 | N34-52 | N36-28 | N33-48 | N34-56 |
| Longitude | W117-02 | W118-22 | W114-36 | W116-47 | W116-52 | W115-27 | W115-30 |
| Elevation | 2,162 | 4,108 | 268 | 1,922 | -194 | 973 | 4,350 |
| Temperature Degrees F |
|||||||
|
January |
60.0 31.7 45.9 |
52.9 21.4 37.2 |
67.6 38.2 52.9 |
60.7 35.9 48.3 |
65.3 39.6 52.5 |
64.1 44.1 54.1 |
54.4 36.9 -- |
|
April |
77.0 45.0 61.1 |
70.9 35.8 53.4 |
86.5 52.1 69.3 |
78.0 50.2 64.1 |
89.5 62.1 75.8 |
81.5 59.2 70.4 |
69.5 48.2 -- |
|
July |
102.6 67.2 84.2 |
97.5 56.3 77.0 |
108.7 76.8 92.8 |
104.0 73.2 88.6 |
115.4 88.4 101.9 |
105.2 82.8 94.0 |
94.0 71.1 -- |
|
October |
83.0 48.1 65.5 |
77.1 37.4 57.3 |
90.7 56.1 73.4 |
83.2 54.6 68.9 |
92.9 62.9 77.9 |
87.5 64.6 76.1 |
75.1 54.4 -- |
|
Annual |
80.3 47.7 64.0 |
74.4 37.6 56.0 |
88.1 55.4 71.8 |
81.1 53.2 67.2 |
90.4 63.0 76.7 |
84.3 62.4 74.3 |
73.0 52.3 -- |
|
Precipitation |
|||||||
| January | .66 | 1.32 | .44 | .56 | .27 | .41 | 1.54 |
| April | .22 | .31 | .17 | .27 | .14 | .14 | .53 |
| July | .31 | .19 | .11 | .32 | .16 | .41 | .90 |
| August | .30 | .11 | .94 | .50 | .09 | .56 | 1.80 |
| October | .19 | .17 | .32 | .17 | .11 | .25 | .73 |
| Annual | 4.14 | 5.61 | 3.75 | 3.81 | 2.03 | 3.26 | 11.82 |
|
Wind Speed |
|||||||
| January | 7.1 | 6.5 | 8.6 | ||||
| April | 10.1 | 8.9 | 13.8 | ||||
| July | 8.3 | 9.4 | 12.2 | ||||
| August | 8.4 | 8.8 | 11.4 | ||||
| October | 8.1 | 6.7 | 9.5 | ||||
| Annual | 8.4 | 7.8 | 10.9 |
| Location | Needles FAA | Palm Springs |
Palmdale |
Parker Reservoir | Randsburg | Thermal FAA |
Twentynine Palms |
| Latitude | N34-46 | N33-49 | N34-35 | N34-17 | N35-22 | N33-38 | N34-08 |
| Longitude | W114-37 | W116-32 | W118-06 | W114-10 | W117-39 | W116-10 | W116-02 |
| Elevation | 913 | 411 | 2,596 | 738 | 3,570 | 120 | 1,975 |
| Temperature Degrees F |
|||||||
|
January |
62.9 40.9 51.9 |
69.3 40.8 55.1 |
58.6 32.2 45.4 |
63.9 42.4 53.2 |
53.8 35.7 44.7 |
69.8 38.3 54.1 |
62.7 35.3 49.0 |
|
April |
83.4 56.3 69.9 |
86.2 52.2 69.2 |
72.9 42.6 57.8 |
83.3 58.7 71.1 |
71.0 45.6 58.4 |
85.6 55.1 70.4 |
81.0 48.5 64.7 |
|
July |
108.7 83.1 95.9 |
109.1 74.1 91.7 |
97.7 65.0 8.14 |
107.8 83.4 95.6 |
98.8 68.7 83.8 |
106.9 76.9 91.9 |
105.4 72.1 88.7 |
|
October |
87.9 61.1 74.7 |
92.1 57.9 75.0 |
80.6 47.4 64.0 |
89.5 64.4 77.0 |
77.1 53.2 65.2 |
91.0 57.8 74.4 |
86.0 52.7 69.6 |
|
Annual |
85.5 60.1 72.8 |
88.8 55.8 72.3 |
77.1 46.4 61.6 |
85.5 61.9 73.9 |
74.9 50.4 62.7 |
88.1 56.7 72.4 |
83.5 51.8 67.7 |
|
Precipitation |
|||||||
| January | .52 | 1.26 | 1.73 | .78 | 1.23 | .52 | .42 |
| April | .26 | .17 | .53 | .23 | .40 | .07 | .12 |
| July | .47 | .04 | .04 | .31 | .12 | .18 | .67 |
| August | .67 | .06 | .23 | .60 | .16 | .30 | .68 |
| October | .35 | .65 | .16 | .46 | .20 | .14 | .26 |
| Annual | 4.39 | 5.20 | 7.38 | 4.97 | 5.48 | 2.82 | 3.89 |
|
Wind Speed |
|||||||
| January | 6.6 | 8.8 | 5.0 | 6.1 | |||
| April | 10.3 | 12.9 | 8.3 | 9.9 | |||
| July | 9.7 | 12.0 | 7.0 | 8.1 | |||
| August | 8.9 | 10.8 | 6.2 | 7.5 | |||
| October | 8.0 | 9.2 | 5.9 | 6.0 | |||
| Annual | 8.7 | 10.6 | 6.5 | 7.6 |
Temperature and precipitation data from: NOAA, National Climatic
Center (re-compiled by Gale Research Company, 1983, Climate Normals for
the U.S. [Base: 1951-1980]: Detroit, MI.) **Mitchell Caverns, CA data
reported from 1971 to 2000.
Wind data from:
Western Regional
Climate Center (
Desert Research Institute
and others; Reno, NV): The
monthly average wind speeds are based on hourly observations from
reporting airports and based on data from 1992-2002.
Next > Geologic History